Automation - Example Projects Details
The Project menu allows a user to create a new project or open an existing one.

New Example
Clicking Project → New Example will open example project. Items marked with a red asterisk are required.
Please fill in the information:
- Project Path – Path to the where the new project folder will reside
- Zipped results Path – Path to the example results zip file
- Project Directory Name – Name to use for the project folder
- Project Label - Text at the top of the project to track multiple projects.
- Test Types:
- IEEE 1547.1 Clause 5 and 6 – Type testing compliant with the standard using communications to DAS, DC/AC simulators, and EUTs.
- UL 1741 SB Tests – directly references UL 1741 SB.
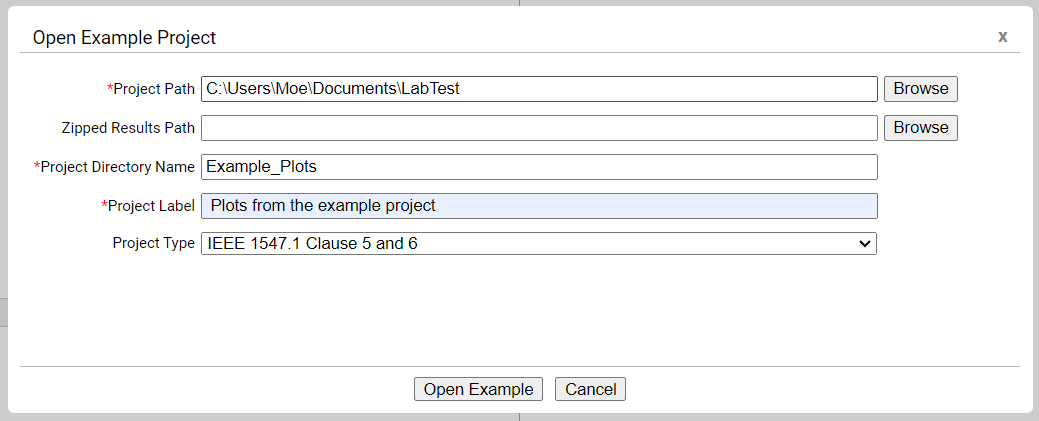
Note: current implementation does not support cloud drives such as Microsoft OneDrive or Google Drive.
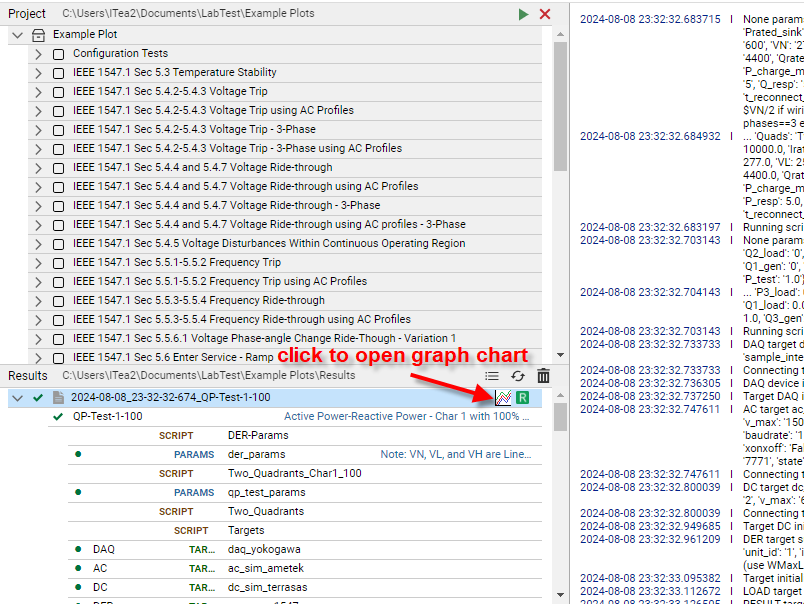
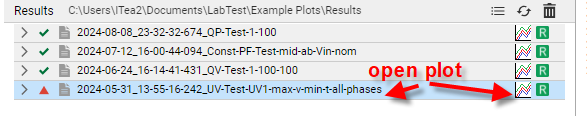
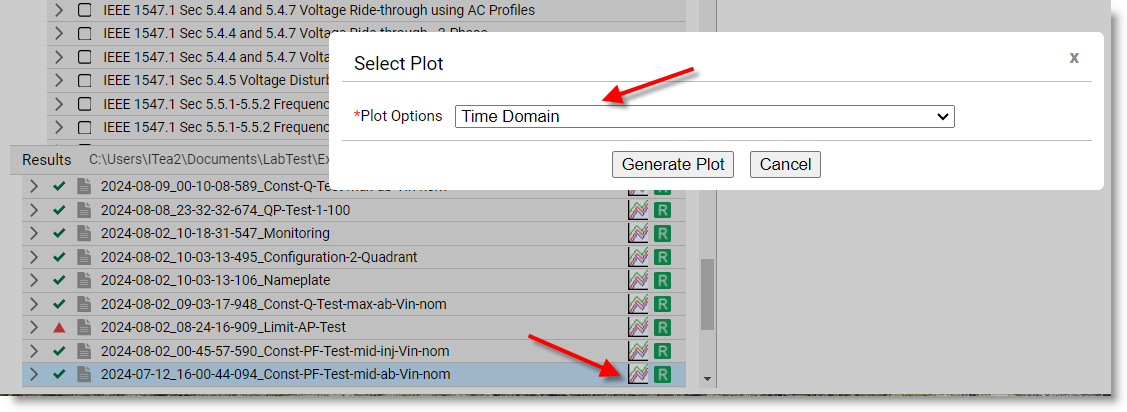
Once example project has been open. Automation → Project → New Example will show the results: then choose one and click on the coresponding graph icon
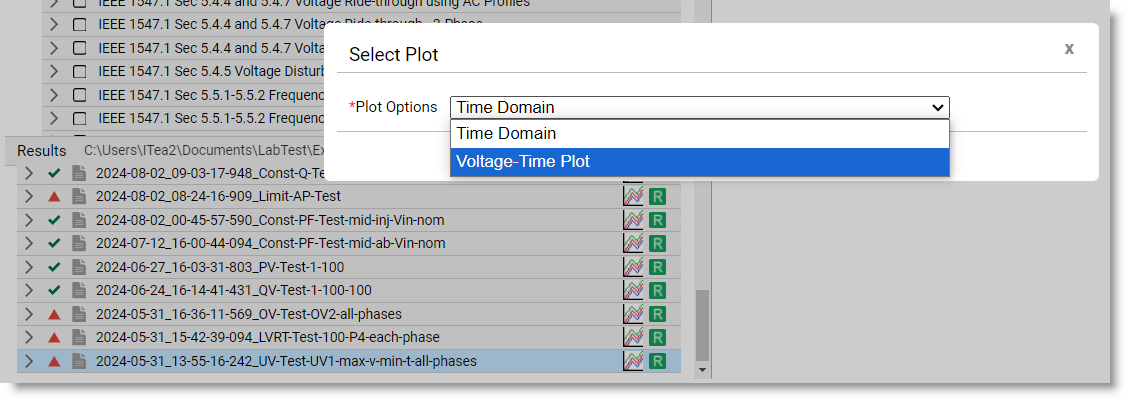
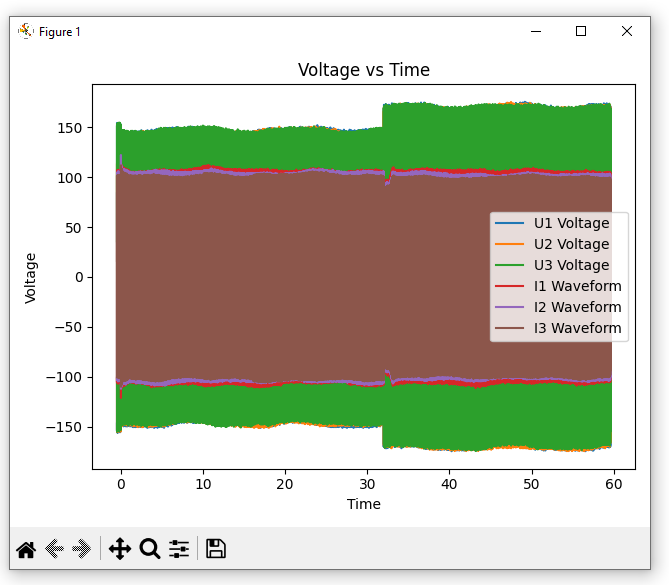
Example 1: Voltage-Time Plot
 Voltage vs Time
Select “Voltage-Time Plot” and click “Generate Plot” to view the corresponding graph.
 Voltage vs Time
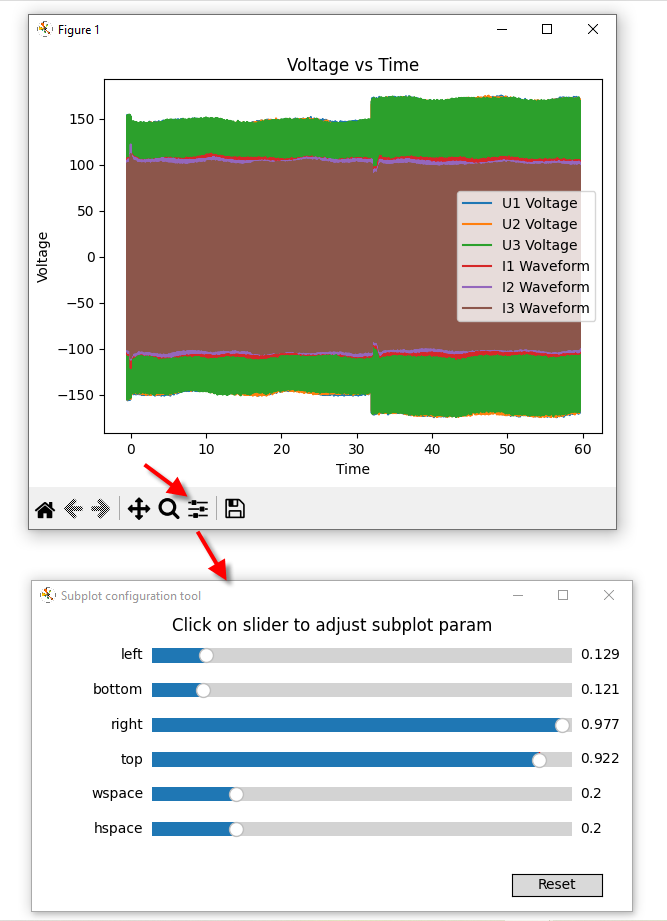
 Click on slider to adjust subplot param
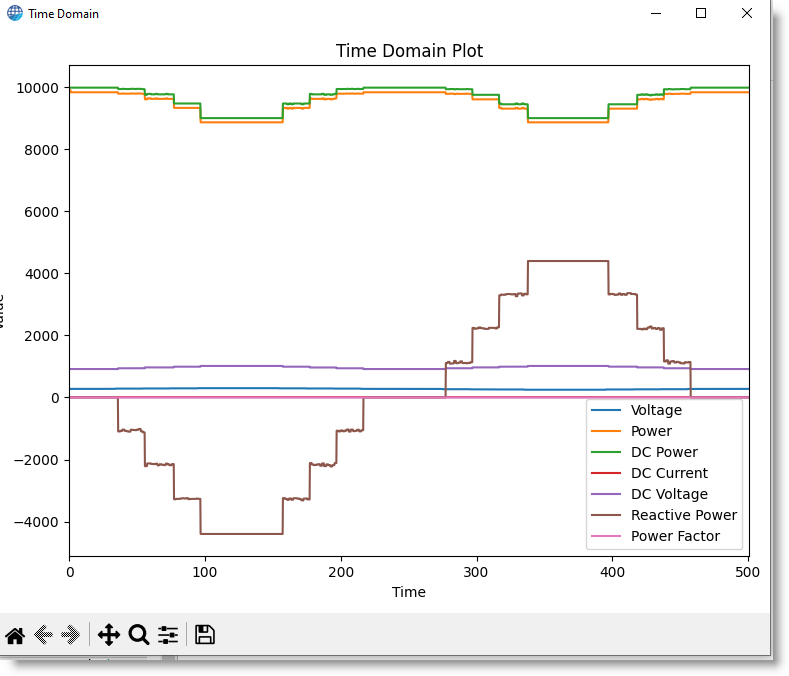
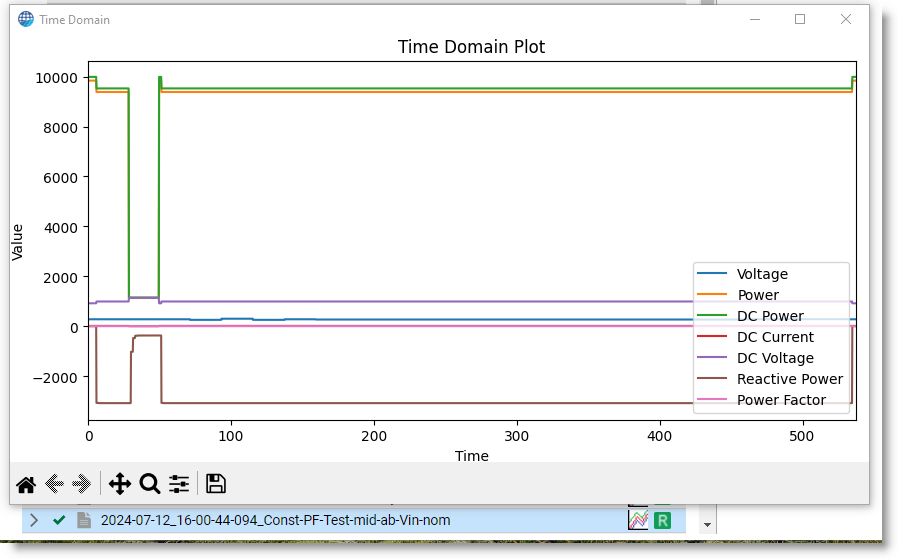
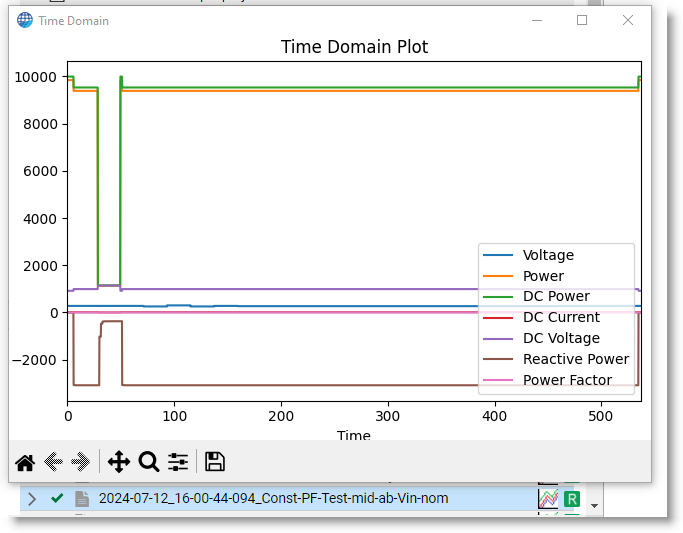
Example 2: Time Domain Plot
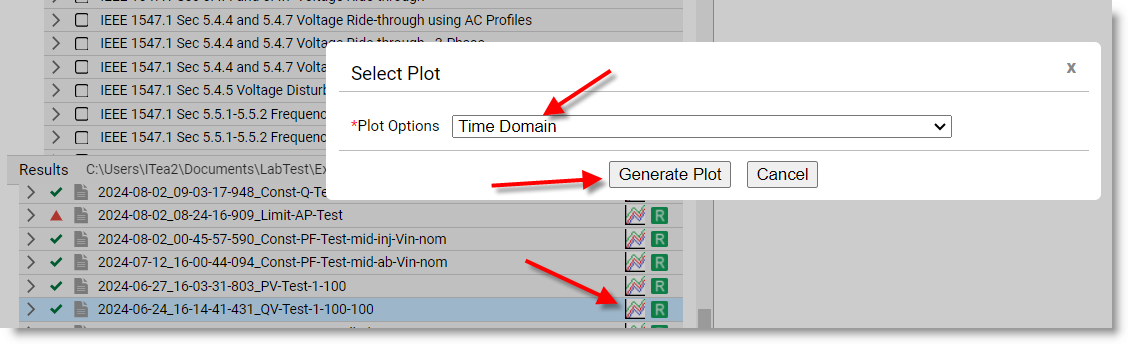
Select “Time Domain” and click “Generate Plot” to view the corresponding graph.
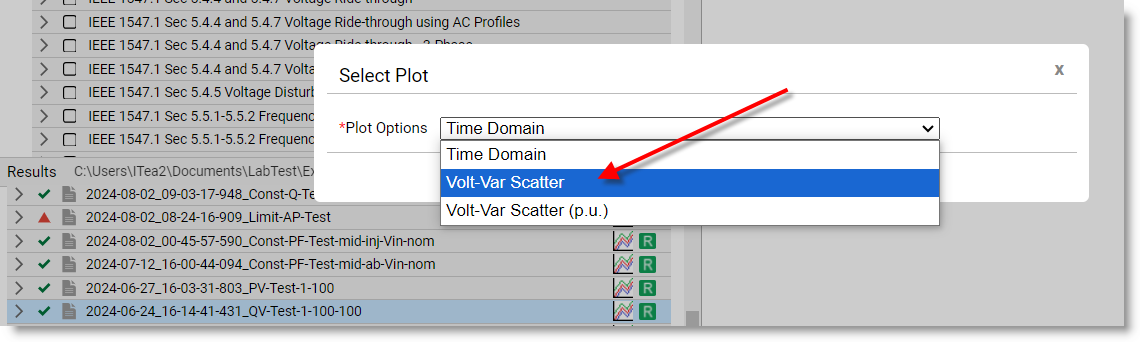
Example 3: Volt-Var Scatter Plot
Select “Volt-Var Scatter” and click “Generate Plot” to view the corresponding graph.
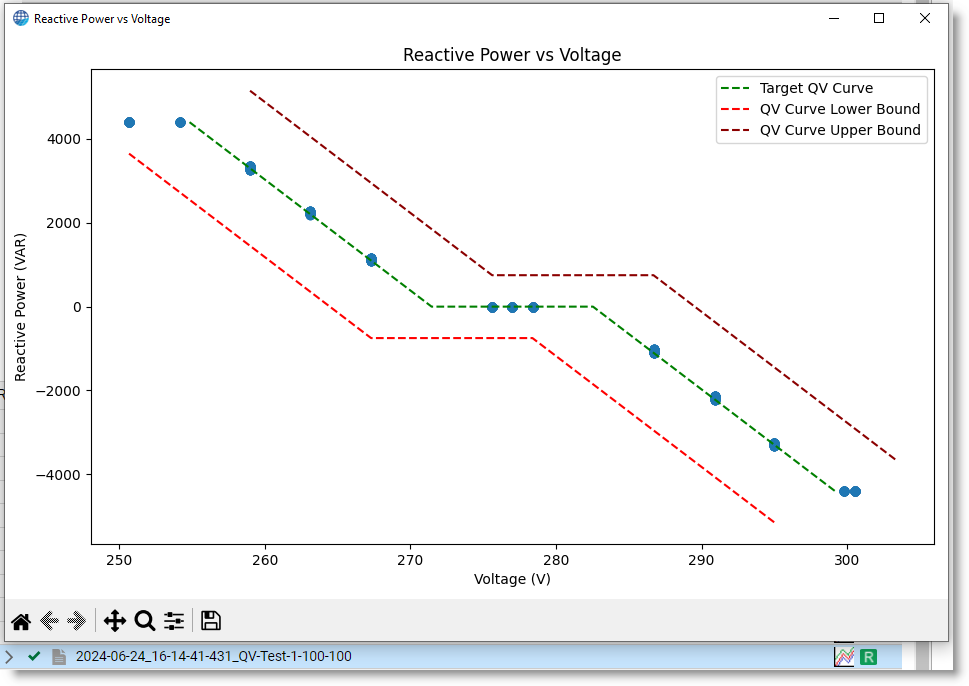 Reactive power vs Voltage
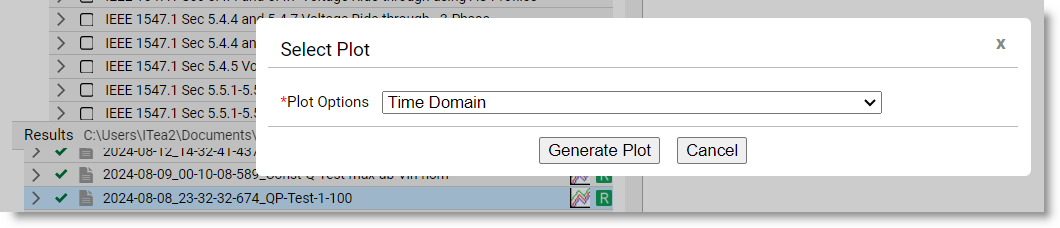
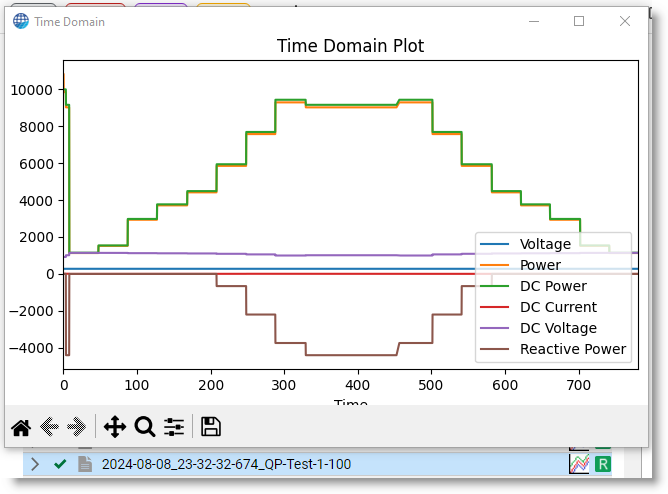
Example 4: Time Domain Plot
Select “Time Domain” and click “Generate Plot” to view the corresponding graph.
Example 5: Constant PF Scatter Plot
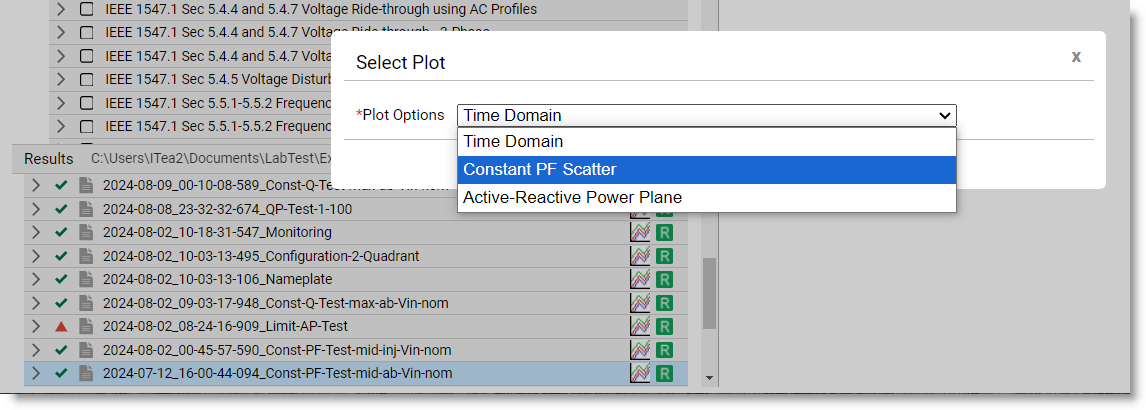
Select “Constant PF Scatter” and click “Generate Plot” to view the corresponding graph.
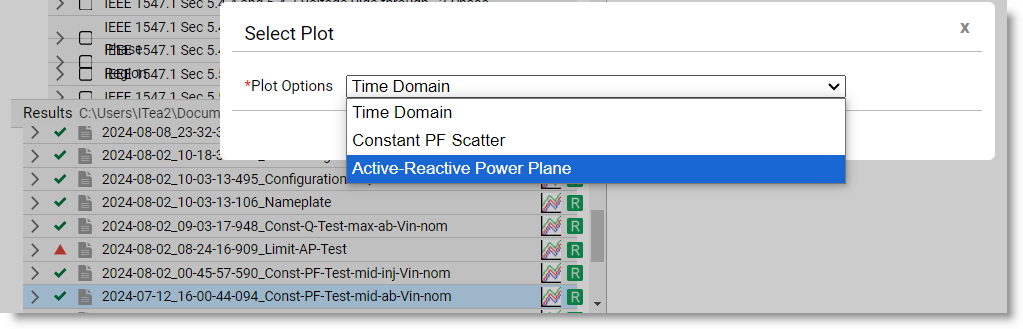
Example 6: Active-Reative Power Plane
Select “Active-Reactive Power Plane” and click “Generate Plot” to view the corresponding graph.
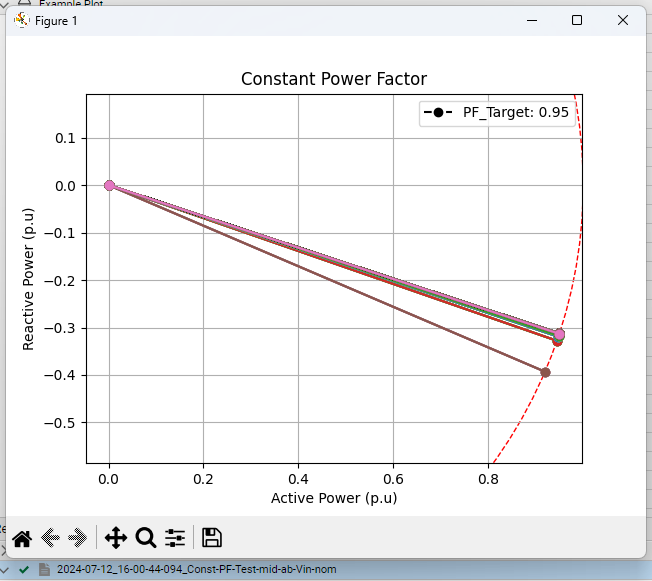 Constant Power factor
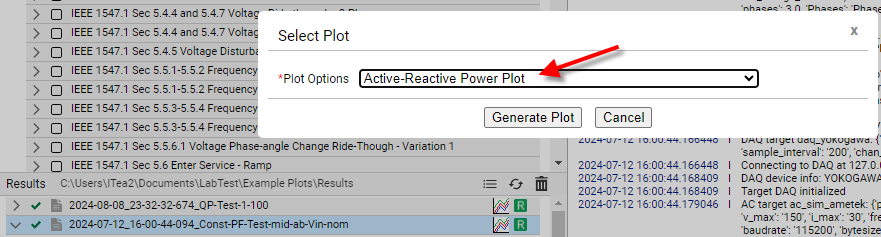
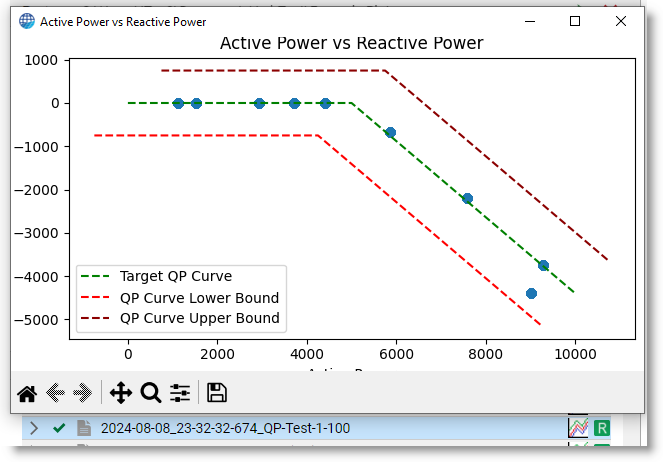
Example 6: Active-Reative Power Plot
Select “Active-Reactive Power Plot” and click “Generate Plot” to view the corresponding graph.
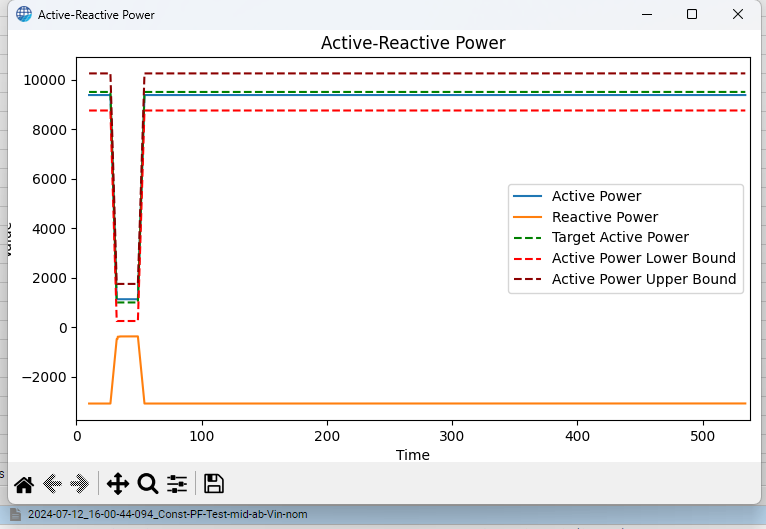
 Constant Power factor
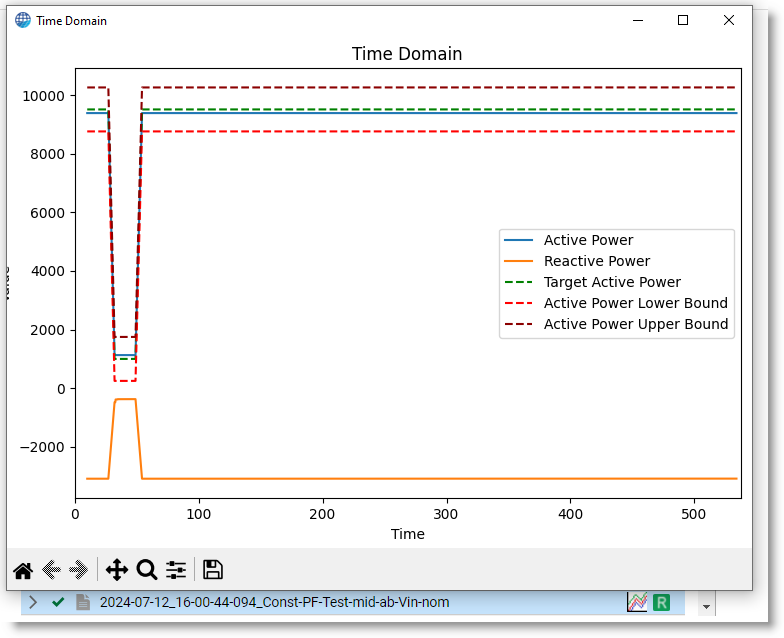
Example 7: Time Domain Plot
Select “Time Domain” and click “Generate Plot” to view the corresponding graph.
Example 8: Watt-Var Scatter
Select “Watt-Var Scatter” and click “Generate Plot” to view the corresponding graph.

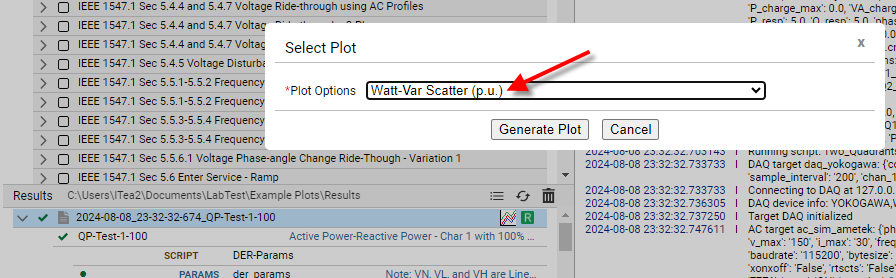
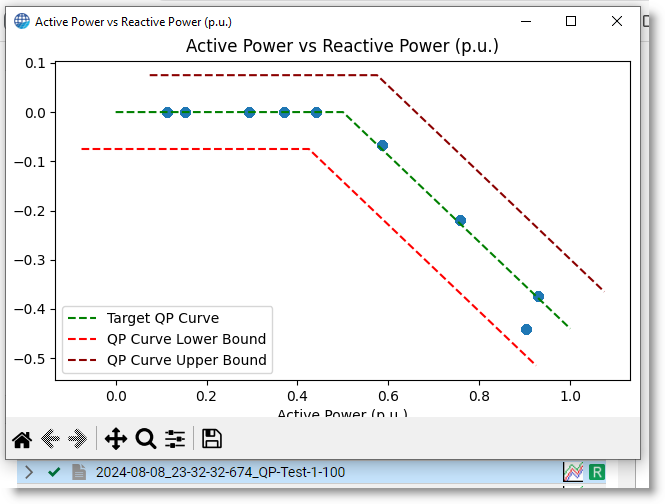
Example 9: Watt-Var Scatter (p.u.)
Select “Watt-Var Scatter (p.u.)” and click “Generate Plot” to view the corresponding graph.