Logs view
The dashboard's Logs tab is a filterable view onto the
simulator's in-process log buffer — the same log_debug, log,
log_warning, log_error calls every module makes. It's the
single best place to figure out what the simulator was actually
doing during a test run without having to scroll the container's
stdout.
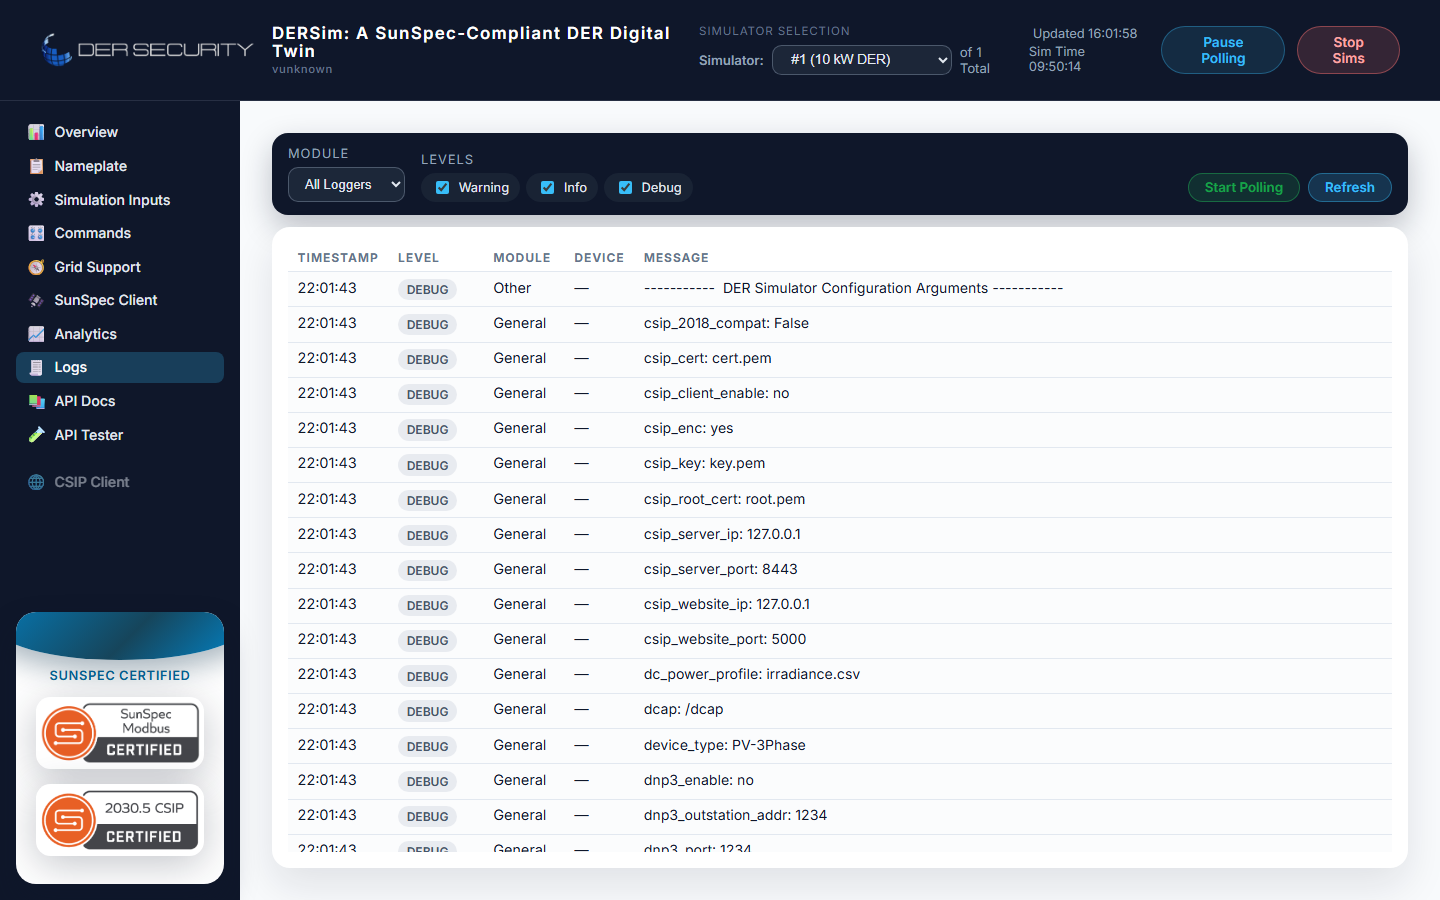
Filters
Two filter axes at the top of the view:
- Module — drop-down picker covering every module that emits
logs in the current run. The dashboard auto-discovers the set
from the log buffer, so a run with
--ocpp_enable yesshowsOCPPin the list and a non-OCPP run doesn't. - Levels — checkbox chips for
Debug,Info,Warning,Error. Toggle each independently; the table re-filters immediately.
The module column auto-hides when you've picked a single module (redundant) and re-appears when you switch to All (so you can see what generated each line).
Module tags
DERSim tags every log line with the originating module. The current set:
| Module | What it tags | Volume |
|---|---|---|
Lab |
Top-level supervisor — startup, device init, shutdown | low |
AC |
AC-side inverter — Modbus updates, grid-support computations | high |
DC |
DC-side source — PV / wind / fuelcell / battery telemetry | high |
Modbus |
SunSpec Modbus server — register reads / writes | medium |
WS |
Web server — HTTP request log, WebSocket connect / disconnect | medium |
CSIP |
IEEE 2030.5 client — discovery, DERControl events, register-end-device | low when idle |
OCPP |
OCPP charge-point bridge — boot, status notifications, transactions | low when idle |
DNP3 |
DNP3 outstation — class polls, control commands | low when idle |
For a quiet "is it alive" check, filter to Lab + Info — you'll see
startup banners and minute-cadence heartbeats. For chasing a wire
problem, filter to the relevant comm module + Warning + Error.
Polling
The view has a Start Polling / Stop Polling toggle that controls live refresh. With polling on, the view fetches new entries every second and prepends them to the top of the table. With polling off, it stays at whatever you last saw (useful when you're scrolling through a specific moment without it scrolling away).
The Refresh button does a one-shot fetch without enabling polling.
Backing REST surface
The view is driven by the GET /api/dersim/logs endpoint:
GET /api/dersim/logs?modules=OCPP,CSIP&levels=warning,error&limit=200
Query parameters:
| Parameter | Type | Default | Notes |
|---|---|---|---|
modules |
comma-separated string | (all modules) | Restricts results to the listed modules (case-insensitive) |
levels |
comma-separated string | (all levels) | One or more of debug, info, warning, error |
limit |
int | 1000 | Max entries returned — newest first |
The response is a JSON array of log entry objects with timestamp,
level, module, device_id (may be null), and message fields.
When to reach for the Logs view vs container stdout
| Use case | Reach for |
|---|---|
| Quick "what just happened" check | Logs view (filtered) |
| Filtering by module + level | Logs view |
| Reading a wall of timestamp-ordered output | docker logs <container> |
| Saving / tailing into a file | docker logs --follow > run.log |
| Reading from a non-dashboard environment (headless) | GET /api/dersim/logs |
The Logs view is opinionated about ordering (newest-first) and display (level color-coded), which is usually what an operator wants. Container stdout is opinionated about being raw, which is what a debugger wants.
Tips
- Module-level color coding makes the table scannable —
ACandDCget different highlight stripes so you can pick out the power-flow chatter from the comm chatter at a glance. - The Message column is
<pre>formatted, so multi-line tracebacks preserve their indentation. Useful when a CSIPDERControlevent serialises as a multi-line XML blob. - For burst-mode investigation, set the level filter to Error + Warning before the test runs, then toggle to Info-and-below after the run to read the surrounding context.